
|
|
||
|
|
|
|
|
|
||
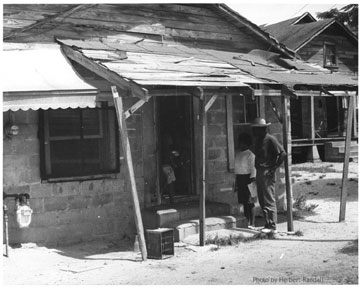
Photo: “Reverend Jim Nance participates in voter registration canvassing,”
by Herbert Randall, 1964
Provided by the McCain Library and Archives, University of Southern Mississippi
Reprinted with permission of Herbert Randall
STATISTICS ON EDUCATION, HOUSING,
INCOME AND EMPLOYMENT, AND HEALTH
The relationship between jobs and education is quite clear. The threat of automation on the uneducated and unskilled is clear. In an age of specialization and skill, nobody wants an illiterate. Nobody wants to take the time and money needed to help these people—nobody in the deep south where the problem is greatest. The South does not want to lose “its” cheap labor nor run the risk of really educating Negro laborers. While there are federal programs of training and assistance, these are under state and local control to a great extent—and therefore, are not at all beneficial to Negroes.
The South has the highest illiteracy rate in America. To maintain separate schools is costly; consequently neither school is very good and, of course, the Negro schools are inferior to the bad “white” schools. Adult education doe not reach the Negro and neither does realistic vocational education. The states manage to keep most federal money in white institutions. It will be necessary to set up new institutions to handle the training for Negro adults and school dropouts—we are trying to do this now. Otherwise, these people will never be free—no matter what civil rights are put on the books.
In most southern states, approximately half of the students drop out of high school. Forty-three percent of Mississippi high school students left before graduating in 1962. They entered the labor market, most of them, and one out of four could not find a job. Of the present population in Mississippi—8,444 whites have never been to school—and 32,196 Negroes. There are 40,274 functionally illiterate whites and 119,741 functionally illiterate Negroes in the state right now.
It is little wonder that 90% of Mississippi’s sharecropper force is Negro.
Table 1. School Completion in the South, By States, 1962, NEA Report, January 1963
|
State |
Percent to graduate |
State |
Percent to graduate |
|
Florida |
63 |
North Carolina |
57 |
|
Texas |
61 |
Tennessee |
55 |
|
Arkansas |
58 |
Alabama |
55 |
|
Louisiana |
58 |
South Carolina |
54 |
|
Mississippi |
58 |
Kentucky |
52 |
|
Georgia |
52 |
Virginia |
52 |
Table 2. Years of School Completed by Persons 25 or Older, 1960 U. S. Bureau of the Census
|
|
Years Completed |
|||||||
|
none |
1-4 |
5-6 |
7 |
8 |
9-11 |
12 |
||
|
NON-WHITE (383,017) |
||||||||
|
percentage |
8.4 |
31.3 |
20.2 |
9.1 |
12.4 |
11.1 |
4.2 |
|
|
WHITE (681,959) |
||||||||
|
percentage |
1.2 |
5.9 |
7.6 |
5.6 |
14.4 |
23 |
24.6 |
|
Median grade: Nonwhite = grade 6; White = grade 11
Table 3. Illiteracy and Functional Illiteracy in the South, 1960
U.S. Census 1960 and New York Times (April 8, 1962)
|
State |
ILLITERACY percent of population |
FUNCTIONALILLITERACY percent of population |
|
Florida |
2.6 |
10.8 |
|
Kentucky |
3.3 |
16.2 |
|
Virginia |
3.4 |
15.3 |
|
Tennessee |
3.5 |
17.3 |
|
Arkansas |
3.6 |
18.0 |
|
North Carolina |
4.0 |
19.3 |
|
Texas |
4.1 |
15.7 |
|
Alabama |
4.2 |
19.1 |
|
Georgia |
4.5 |
20.6 |
|
Mississippi |
4.9 |
22.0 |
|
South Carolina |
5.5 |
23.8 |
|
Louisiana |
6.3 |
24.9 |
Statistics revealing housing conditions for Mississippi Negroes are somewhat shocking. In 1960 there were 207,611 housing units for Mississippi Negroes. Of these, 38 percent were owner-occupied, and 62 percent were renter-occupied (significantly out of line with the national proportion of owner and renter occupied housing). Of the 207,611 houses, only one-third can be classed as being in sound condition; the others have been classified as either deteriorating or dilapidated. Of the homes in the rural areas, over 75 percent are without any piped water at all, and over 90 percent of these rural homes had no flush toilets, no bathtub and no shower.
Table 4 Negro housing in Mississippi, 1960, U.S Bureau of the Census
|
|
Total |
Urban |
Rural |
|
Total Housing Units |
207,611 |
77,824 |
129.787 |
|
Owner occupied (#) |
79,059 |
32,913 |
46,146 |
|
Owner occupied (%) |
38.1 |
42.3 |
35.6 |
|
Renter occupied (#) |
128,552 |
44,911 |
83,641 |
|
Renter occupied (%) |
61.9 |
57.5 |
64.4 |
|
|
|||
|
Condition |
|||
|
Owner occupied |
|||
|
Sound |
36,656 |
17,677 |
18,979 |
|
Deteriorating |
27,545 |
10,005 |
17,540 |
|
Dilapidated |
14,858 |
5,231 |
9,627 |
|
Renter occupied |
|||
|
Sound |
33,169 |
15,294 |
17,874 |
|
Deteriorating |
52,629 |
15,937 |
36,692 |
|
Dilapidated |
42,755 |
13,680 |
29,075 |
|
|
|||
|
Water Supply |
|||
|
Hot and Cold water piped inside |
40,870 |
33,181 |
7,689 |
|
Only cold water piped inside |
39,101 |
30,376 |
8,725 |
|
Piped water outside |
27,502 |
10,229 |
17,273 |
|
No piped water |
100,138 |
4,038 |
96,100 |
|
|
|||
|
Toilet Facilities |
|||
|
Flush Toilet, exclusive use |
62,160 |
52,481 |
9,679 |
|
Flush Toilet, shared use |
7,570 |
6,965 |
605 |
|
None |
137,881 |
18,378 |
119,505 |
|
|
|||
|
Bathing Facilities |
|||
|
Bathtub or shower, exclusive use |
44,991 |
36,333 |
8,658 |
|
Bathtub or shower, shared use |
2,207 |
1,807 |
400 |
|
None |
160,413 |
39,684 |
120,729 |
.
Employment problems for the Negroes in the rural South are even more severe than for any group in the United States. Because of segregation . . . the southern Negro has not received adequate training and education. He is an unskilled laborer.
Two things have happened in American labor—there is a shift from the production of goods (farming, for example) to services, and there is a shift from the demand for unskilled, or blue-collar, workers to skilled. Agriculture continues a rapid decline. Within a period of six months, as many as a thousand Negro laborers have been laid off in the Delta. What has happened is very simple—the machine can do more than the man. One mechanical cotton picker can do the work of seventy men in a day’s time. The plane that sprays or dusts the crop replaces hundreds of workers. The tractor is preferred over the man and mule—of course. It takes one man to fly a crop-duster, one man to run the tractor, one man to operate the picker . . . and this means that thousands of Negroes are underemployed, and unemployed. It means that thousands more are going to be completely unemployable . . . unless something is done. Ninety percent of the Delta’s Negro laborers are unskilled and lacking in adequate education. The day is coming when nobody will want these people—not even for once-a-month days when the machine cannot go out, because soon they will get a machine that can go out—in any kind of weather.
Automation and technology—complicated problems. But the simple truth now is that either these people get help, or they will starve. No stopgap measure will suffice. Older Negroes never had a chance to learn; younger Negroes, because they have to stop school and go to work in the field, are not getting the chance either. In America last year, one out of every four young Negroes went without jobs for the whole year—this was in the North, too. So migration is not the solution. Next year a million and a half young people will enter the labor market without having finished high school, many without finishing eighth grade. MOST OF THEM WILL BE NEGRO.
The Federal government defines “poverty” as an annual income under $4,000. Most Negro families in the rural South earn less than $2,000 annually.
In 1959, thirty-seven percent of all Mississippi Negroes earned less than $1000. Fifty-one percent of these were on Delta farms, and many of the others were in Delta town, such as Cleveland and Greenwood.
In 1960 Negroes had an average annual income of $606, only 29% of the average income of 2,023 among whites. The difference seems particularly wide in view of the fact that a higher proportion of Negro families are in the labor force. The data show that a high proportion of Negro males under age 24 and women over age 24 are in the labor force than is the case among whites.
Table 5. Median Income for Persons, 1950 and 1960U. S. Bureau of Census
|
|
1950 (in dollars) |
1960 (in dollars) |
||||
|
|
state |
urban |
rural |
state |
urban |
rural |
|
nonwhite |
440 |
693 |
390 |
606 |
871 |
474 |
|
white |
1236 |
1826 |
973 |
2023 |
2622 |
1605 |
Table 6. Rate of Unemployment, U. S. Bureau of Census
|
1950 |
White |
2.7 percent |
|
|
Nonwhite |
4.5 percent |
|
1960 |
White |
4.5 percent |
|
|
Nonwhite |
7.1 percent |
Table 7 Employment status of the civilian, noninstitutional population in Mississippi, by color and sex, 1960 (% distribution)
|
|
White |
Nonwhite |
||||
|
Employment status and sex |
Urban |
Rural non farm |
Rural farm |
Urban |
Rural non farm |
Rural farm |
|
Both sexes |
||||||
|
Total, 14 years and over |
100.0 |
100.0 |
100.0 |
100.0 |
100.0 |
100.0 |
|
In labor force |
57.6 |
49.3 |
48.9 |
58.1 |
45.7 |
45.1 |
|
Not in labor force |
42.4 |
50.7 |
51.1 |
41.9 |
54.3 |
54.9 |
|
In labor force |
100.0 |
100.0 |
100.0 |
100.0 |
100.0 |
100.0 |
|
employed |
96.0 |
94.6 |
96.3 |
91.2 |
92.9 |
95.3 |
|
unemployed |
4.0 |
5.4 |
3.7 |
8.8 |
7.1 |
4.7 |
|
|
||||||
|
Females |
||||||
|
Total, 14 years and over |
100.0 |
100.0 |
100.0 |
100.0 |
100.0 |
100.0 |
|
In labor force |
37.7 |
29.1 |
24.1 |
48.9 |
30.5 |
21.5 |
|
Not in labor force |
62.3 |
70.9 |
75.9 |
51.1 |
69.5 |
78.5 |
|
In labor force |
100.0 |
100.0 |
100.0 |
100.0 |
100.0 |
100.0 |
|
employed |
95.3 |
95.0 |
95.0 |
92.0 |
91.7 |
90.2 |
|
unemployed |
4.7 |
5.0 |
5.0 |
8.0 |
8.3 |
9.8 |
|
|
||||||
|
Males |
||||||
|
Total, 14 years and over |
100.0 |
100.0 |
100.0 |
100.0 |
100.0 |
100.0 |
|
In labor force |
79.3 |
70.0 |
72.7 |
70.0 |
63.0 |
69.2 |
|
Not in labor force |
20.7 |
30.0 |
27.3 |
30.0 |
37.0 |
30.8 |
|
In labor force |
100.0 |
100.0 |
100.0 |
100.0 |
100.0 |
100.0 |
|
employed |
93.3 |
94.5 |
96.7 |
94.5 |
93.5 |
96.9 |
|
unemployed |
3.7 |
5.5 |
3.3 |
5.5 |
6.5 |
3.1 |
Number and Proportion: 915,722 Negroes constituted, in 1960, roughly 42% of the total 2,178,000 population in Mississippi. Between 1940 and 1960, the total population remained nearly the same (percent change: -0.2), with a more than 7% decrease in the Negro population compared with an increase of more than 6% among the non-Negro population. (See Table 8.)
Although birth rates among Negroes have been consistently higher than those among whites, mortality rates are higher, average life expectancy is lower and migration out of the state is considerably higher among Negroes than among whites.
Birth Rates: The higher birth rates among Negroes, in comparison with whites, are shown in Table 9. In 1948, the rate per 1,000 among the Negro population was 34.8, compared with 21.8 among whites. Since 1945 there has been a significant rise in the birth rate for Negroes. During the depression 30’s, sharp declines in birth rates occurred among both Negroes and whites. (Table 9.)
Death Rates: Death rates among Negroes continue to be higher than the rates for whites, although the difference in the rates has consistently narrowed. (Table 10.) It is still a fact, however, that the death rate among Negroes today is not as low as it was for whites in 1913, the first year for which we have death rate data. This is largely a reflection of the continued low standard of living Mississippi Negroes exist under, in addition to a lack of access to adequate hospital care.
Infant Mortality: Infant mortality rates since 1920 for both races have generally gone downward. The rate for nonwhites, however, swung upward in 1957 and continued upward until 1961 when it started downward again. It takes no statistical genius to understand what the figures reflect: In Mississippi, the chances for a Negro baby dying within the first year of life are at best twice those of a white baby. Though most babies of both races do survive, Negro babies have a greater chance of starting life with a health handicap. In communities where Negroes are subject to major segregation and discrimination, the Negro baby is much more likely to be born prematurely. Premature babies may get excellent care if they are born in or near a hospital with a modern center for premature infants, but Negroes in Mississippi are largely denied this. (Table 11.)
Table 8. Population of Mississippi, by color, 1900-1960
U.S. Bureau of the Census
Nonwhite
Year Total Number Percentage
1960 2,178,141 920,595 44.4
1950 2,178,914 990,282 45.5
1940 2,183,796 1,077,469 49.1
1930 2,009,821 1,011,744 50.5
1920 1,790,618 936,656 52.5
1910 1,797,114 1,011,003 56.2
1900 1,551,270 910,070 58.6
Table 9. Estimated Birth Rates Mississippi State Board of Health
Births per 1,000 population
Year Nonwhite White
1961 35 22
1959 37 21
1955 37 23
1950 38 23
1940 27 21
1935 25 21
1930 24 23
1925 23 24
1920 23 26
Table 10. Death Rates
Deaths per 1,000 population
Year Nonwhite White
1961 11 9
1959 11 8
1955 10 9
1950 11 8
1940 13 9
1935 12 9
1930 15 9
1925 14 9
1920 15 9
Table 11. Deaths Under One Year,
per 1,000 population
Year Nonwhite White
1961 50 23
1960 54 24
1955 46 25
1950 43 28
1945 45 36
1940 61 46
1935 85 51
1925 86 53
1920 101 60
The document is from the
Iris Greenberg / Freedom Summer Collection, 1963-1964
Manuscripts, Archives, and Rare Books Division,
Schomburg Center for Research in Black Culture,
The New York Public Library;
Astor, Lenox and Tilden Foundations